LIVE/WORK, 2013
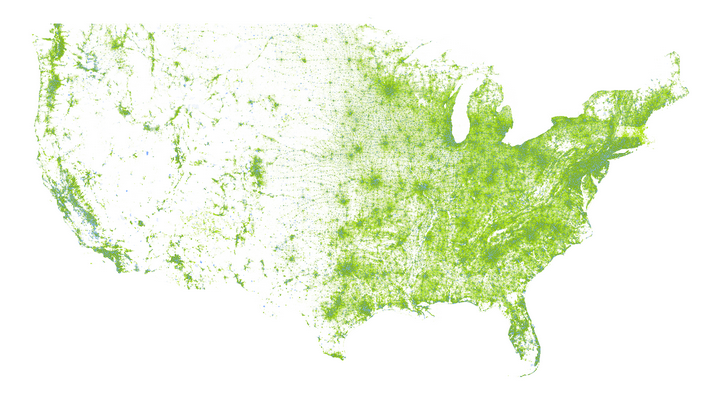
This is a countrywide map of where Americans live and work. Each dot represents either where an employee lives (green) or works (blue). The data is from the Longitudinal Employer-Household Dynamics (LEHD) program. The zoomable map can be seen here.
The Data
The data lists for each employee the Census block they live in and the block they work in. The data is anonymized to provide confidentiality, but can still be used to make visualizations of where individuals work and live. The map is made from the all jobs data set; so individuals who work multiple jobs are mapped for each job. Unemployed individuals are not mapped. Massachusetts is the only state that does not currently provide data as part of the program; so those who live there and work in other states show up, but anyone who works in Massachusetts is not included.
Methodology
The data was aggregated to count the number of jobs and employee household in each Census block. With the data counted at the block level I only slightly modified the code that was well documented from these two projects: Brandon Martin-Anderson's Census Dotmap and Dustin Cable's Racial Dot Map.
Any feedback, errors or questions would be greatly appreciated at: justin@justinjoque.com