MAPPING INEQUALITY, 2012
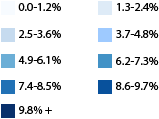
This interactive map displays five variables at the county level, including the Gini index, which ranges from zero, representing complete income equality (everyone earns the same amount) to one, representing complete inequality (one inidividual earns all income). Mousing over a county will display the data for that county.
ACS 2006-2010: Income and Income Inequality in the US by County
USA
Entire Country
Unemployment: 7.9%
Gini Index: 0.47
Poverty Rate: 13.8%
Median Household Income: $51,914
Households with Interest or Rental Income: 24.2%
Data: U.S. Census Bureau. Unemployement, American Community Survey 2006-2010. Prepared by Social Explorer.
Mouse over counties for more details